
Wednesday, 14 January, 2026г.


Где искать: по сайтам Запорожской области, статьи, видео ролики
пример: покупка автомобиля в Запорожье
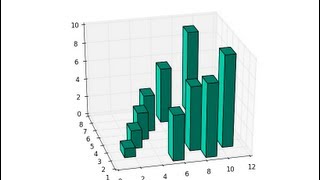
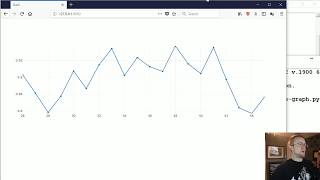
3D Bar Charts in Python and Matplotlib
 У вашего броузера проблема в совместимости с HTML5
Besides 3D scatter plots, we can also do 3D bar charts. This again allows us to compare the relationship of three variables rather than just two. 3D bar charts with matplotlib are slightly more complex than your scatter plots, because the bars have 1 more characteristic: depth. Basically, the "thickness" of the bars is also define-able. For most, this will be simply a pre-determined set of data, but you can actually use this for one more "dimension" to your plot.
Sample code: http://pythonprogramming.net/3d-bar-charts-python-matplotlib/
Full Playlist: http://www.youtube.com/playlist?list=PLQVvvaa0QuDfpEcGUM6ogsbrlWtqpS5-1
Sentdex.com
Facebook.com/sentdex
Twitter.com/sentdex
How to make a 3D bar chart in python.
Теги:
Matplotlib (Software) How-to (Media Genre) 3D programming 3D graphing python how to make 3D graphs python Python Programming Language 3d bar chart python 3D Modeling (Profession) 3D bar chart 3d matplotlib how to make 3D graphs 3D graph programming matplotlib 3d plot Python (Software)
Похожие видео
Мой аккаунт