
Wednesday, 14 January, 2026г.


Где искать: по сайтам Запорожской области, статьи, видео ролики
пример: покупка автомобиля в Запорожье
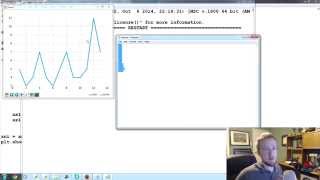
Matplotlib Tutorial 16 - Live graphs
 У вашего броузера проблема в совместимости с HTML5
In this Matplotlib tutorial, we're going to cover how to create live updating graphs that can update their plots live as the data-source updates. You may want to use this for something like graphing live stock pricing data, or maybe you have a sensor connected to your computer, and you want to display the live sensor data. To do this, we use the animation functionality with Matplotlib.
sample code: http://pythonprogramming.net
http://hkinsley.com
https://twitter.com/sentdex
http://sentdex.com
http://seaofbtc.com
Теги:
Matplotlib (Software) Tutorial (Media Genre) Python (Programming Language) live graph live graph chart
Похожие видео
Мой аккаунт