
Wednesday, 14 January, 2026г.


Где искать: по сайтам Запорожской области, статьи, видео ролики
пример: покупка автомобиля в Запорожье
Python In Education: Advanced 2D Plots
 У вашего броузера проблема в совместимости с HTML5
This video describes a few advanced methods for making plots using Python and Matplotlib.
Here, I cover:
* points and lines on the same plot
* logarithmic plots (log-linear)
* error bars (both y and x error bars)
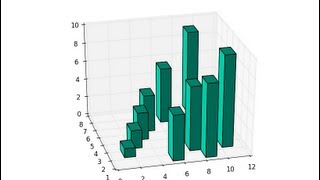
* bar graphs (including stacked bar graphs)
* colored background and grids
* changing the size of axis labels
* adding text and arrows to graphs
* multiple plots next to each other
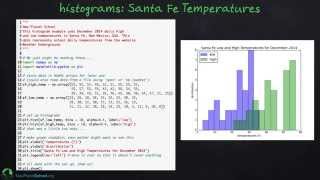
* histograms (data and random numbers)
The best video to watch before you watch this video is this:
http://youtu.be/Wv-r-LNx5Eg
I have all of the Python scripts collected for you to download on Google Drive, which you can find here:
https://drive.google.com/?authuser=1#folders/0B-Hob7Evc6ImdDVUcDZEU05id1k
Теги:
education teaching teacher student Python matplotlib data files reading data csv file txt file comma separated values Python (Programming Language) Students Lesson School Learn readlines
Похожие видео

Мой аккаунт