
Wednesday, 14 January, 2026г.


Где искать: по сайтам Запорожской области, статьи, видео ролики
пример: покупка автомобиля в Запорожье
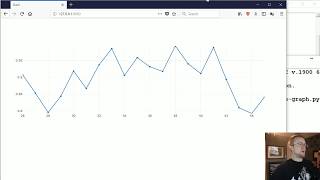
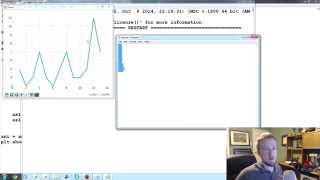
Live Graphs with Events - Data Visualization GUIs with Dash and Python p.4
 У вашего броузера проблема в совместимости с HTML5
How to create live graphs in Python with Dash, the browser-based data visualization application framework.
Text tutorials and sample code: https://pythonprogramming.net/live-graphs-data-visualization-application-dash-python-tutorial/
Discord: https://discordapp.com/invite/3jCqXJj
https://pythonprogramming.net/support-donate/
https://twitter.com/sentdex
https://www.facebook.com/pythonprogramming.net/
https://www.twitch.tv/sentdex
https://plus.google.com/+sentdex
Похожие видео


Мой аккаунт