
Tuesday, 13 January, 2026г.


Где искать: по сайтам Запорожской области, статьи, видео ролики
пример: покупка автомобиля в Запорожье
Statistics 101: Is My Data Normal?
 У вашего броузера проблема в совместимости с HTML5
Statistics 101: Is My Data Normal?
Many statistical techniques assume that the underlying data is normally distributed. What simple techniques can we use to test this assumption? In this presentation we will briefly discuss the following tools to determine if our data is "normal" free of excess skew and/or kurtosis:
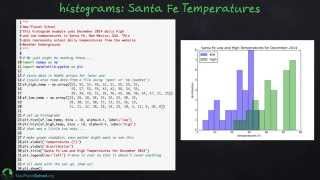
Histograms
Stem and Leaf Plots
Box Plots (Box and Whisker Plots)
P-P Plots
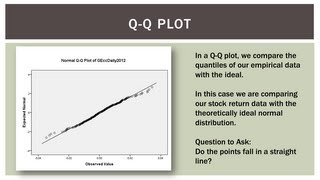
Q-Q Plots
I do not go into how these tools are calculated. This is merely an introduction to common preemptive visual techniques to determine the normality of a data set. Enjoy! For my complete video library organized by playlist, please go to my video page here:
http://www.youtube.com/user/BCFoltz/videos?flow=list&view=1&live_view=500&sort=dd
Теги:
is my data normal is my data normally distributed normality test qq plot q-q plot q q plot qq plots quantile quantile plot p p plot p-p plot pp plot probability plot qq plot excel normal quantile plot p-p plot spss statistics box plot anova logistic regression linear regression anova statistics multiple regression brandon foltz brandon c foltz brandon c. foltz p-value normal distribution statistics 101 box and whisker histogram
Похожие видео


Мой аккаунт