
Friday, 02 January, 2026г.


Где искать: по сайтам Запорожской области, статьи, видео ролики
пример: покупка автомобиля в Запорожье
Two projects where I use QCustomPlot
 У вашего броузера проблема в совместимости с HTML5
Just a video to show some ways of using QCustomPlot to do plotting in Qt. Maybe it'll give other people ideas of how they might use plotting. Or maybe you'll be interested in the projects themselves.
The first project is implementing a perceptron classifier on the Iris dataset:
https://archive.ics.uci.edu/ml/datasets/Iris
It's still a work in progress but I used qcustomplot for simple plotting of the data to visualize.
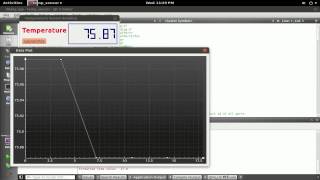
In the second project I modified the previous temperature sensor gui to launch a realtime plot of the data. I'll do a tutorial on it eventually.
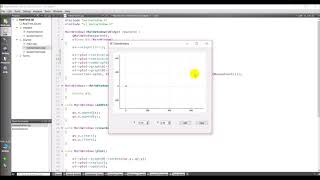
QCustomPlot is a nice, easy to use widget for plotting in Qt. It's available at http://qcustomplot.com/
Consider subscribing for future videos.
Похожие видео


Мой аккаунт