
Wednesday, 14 January, 2026г.


Где искать: по сайтам Запорожской области, статьи, видео ролики
пример: покупка автомобиля в Запорожье
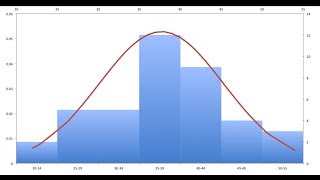
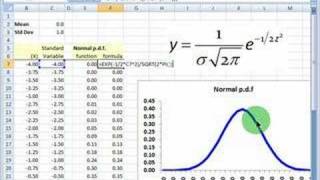
How to create pivot table for Histogram and Normal Distribution Graph in Mac Office
 У вашего броузера проблема в совместимости с HTML5
Apology for the mistakes towards the end.
A better version of how compiling the histogram and normal distribution graph is available. The link is embedded at minutes 15th.
Похожие видео


Мой аккаунт