
Wednesday, 14 January, 2026г.


Где искать: по сайтам Запорожской области, статьи, видео ролики
пример: покупка автомобиля в Запорожье
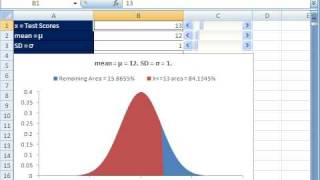
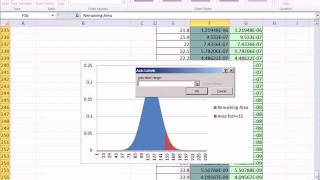
Excel Statistics 68: Normal (Bell) & Standard Normal Characteristics
 У вашего броузера проблема в совместимости с HTML5
Download Excel File: https://people.highline.edu/mgirvin/AllClasses/210M/Content/ch06/Busn210ch06.xls
Download pdf notes: https://people.highline.edu/mgirvin/AllClasses/210M/Content/ch06/Busn210Ch06.pdf
Topics for Continuous Probability Distributions::
1.See Dynamic Chart examples of the Normal / Bell / Standard Normal Curves to learn how probabilities are calculated in Excel
2.Mean = Median = Mode
3.Symmetrical Curve: Both Sides same shape
4.Area equals 1
5.Each half equals .3
6.Empirical / Normal Rule
7.Asymptotic
8.More
Busn 210 Business Statistical Using Excel Highline Community College taught by Mike Gel excelisfun Girvin
Теги:
Excel 2007 Statistics Normal Bell Standard Area Curve Probability Mike Gel excelisfun Girvin Highline Community college
Похожие видео
Мой аккаунт