
Wednesday, 14 January, 2026г.


Где искать: по сайтам Запорожской области, статьи, видео ролики
пример: покупка автомобиля в Запорожье
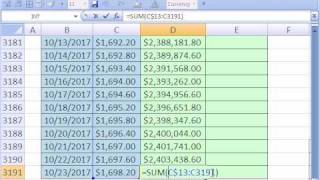
Excel 2010 Statistics 59: Normal Bell Probabilities Above X & Area Charts To Show Area above X
 У вашего броузера проблема в совместимости с HTML5
Download Excel File: https://people.highline.edu/mgirvin/AllClasses/210Excel2010/Content/Ch06/Busn210ch06.xlsm
Download pdf file: https://people.highline.edu/mgirvin/AllClasses/210Excel2010/Content/Ch06/Busn210Ch06.pdf
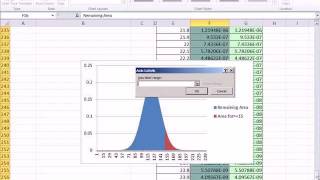
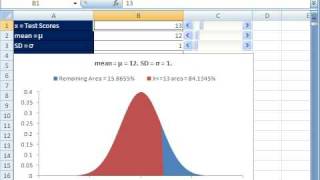
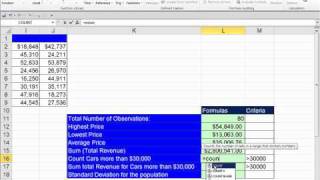
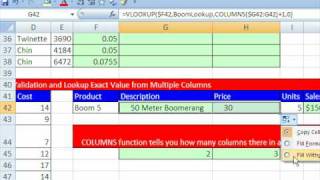
Calculate Probability (area) for Normal Curve for greater than or equal to an X value. Topics for Normal Bell Standard Normal Probability Distributions:
1. Calculate Probability for Normal Curve greater than or equal to an X value
2. NORM.DIST FUNCTION
3. NORM.INV FUNCTION
4. NORM.S.DIST FUNCTION
5. NORM.S.INV FUNCTION
6. Create Area Chart for Normal Curve
7. Create IF function Formula to add a partial area to a full area chart
Statistics functions formulas charts
This is for the Highline Community College Busn 210 Statistical Analysis for Business and Economics taught by Michael Girvin
Теги:
Excel Statistics 2010 excelisfun Mike Gel Girvin Highline Community College Busn 210 Statistical Analysis Business Economics Slaying Dragons Calculate Probability for Standard Normal Curve greater than equal value Bell Shaped NORM.DIST NORM.INV NORM.S.DIST NORM.S.INV function Create Area Chart add partial area full chart functions formulas charts
Похожие видео
Мой аккаунт