
Tuesday, 13 January, 2026г.


Где искать: по сайтам Запорожской области, статьи, видео ролики
пример: покупка автомобиля в Запорожье
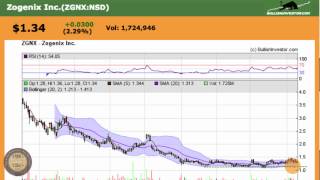
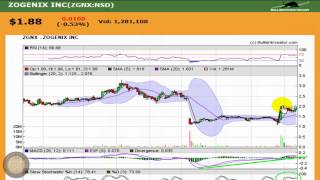
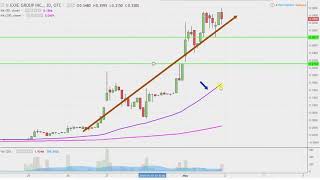
Zogenix (ZGNX) Stock Chart Analysis
 У вашего броузера проблема в совместимости с HTML5
The Zogenix chart continues to form a base and channel essentially between $1.15 and $1.43 for more than three months. The bollinger bands are tightening and the chart has edged over the 50 day moving average as it starts to make higher lows, perhaps signaling that it is finally ready to breakout to the upside.
Теги:
Zogenix ZGNX stock chart analysis penny stock learn technical analysis candlestick charts stock trading stock price
Похожие видео
Мой аккаунт