
Wednesday, 14 January, 2026г.


Где искать: по сайтам Запорожской области, статьи, видео ролики
пример: покупка автомобиля в Запорожье
t Test in SPSS - P-Value; Null Hypothesis; Written Resutls; APA Format (Part 1 of 2)
 У вашего броузера проблема в совместимости с HTML5
How to run and interpret the results for the one sample t test in SPSS is shown in this video (Part 1 of 2).
t test in SPSS; p-value in SPSS
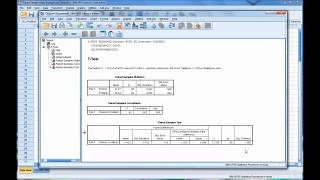
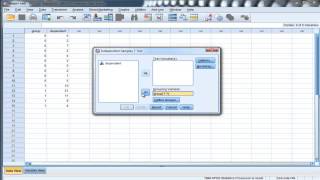
Video Transcript: In this video we'll take a look at a second example involving the one-sample t-test. And here in this example we had the scores for 30 different people on this variable that we named perception. And for the background of the study, in this hypothetical example, we wanted to know whether people view a politician as either significantly favorable or unfavorable. And what we did here 30 people were asked once again hypothetical example but 30 people were asked how do you view blank, whoever the politician is, and then they were asked to respond on the following scale, they could respond from highly unfavorable all the way to highly favorable, they had to choose one of these. So, for example, the first person who was asked this question how do you view the politician. They answered a 2, which indicates that they viewed that politician somewhat unfavorably. The second person chose a 3, meaning they viewed the politician slightly unfavorably. The third person chose a 5, they were slightly favorable, and so on, you can see the ratings here. Now what we're going to do in SPSS for the one-sample t-test is remember we want to know whether people view the politician as either significantly favorable, or significantly unfavorable. Four is an answer that indicates they didn't view the politician is either favorable or unfavorable, but it really was a neutral response. So we want to test in SPSS whether the opinions of the 30 people differ significantly from a 4, as a 4 indicates a neutral response, once again neither favorable or unfavorable. So 4 will be our test value in SPSS. OK so this is our population mean for all intents and purposes. We want to determine if people rate this politician significantly different from neutral. OK and we're going to run this test as a two-tailed test and use alpha of .05. So let's go ahead and take a look at that. So here we'll go to Analyze, Compare Means and One Sample T Test. And then we move our variable perception over to the Test variable(s) box and then remember this Test Value box we need to put in whatever our population mean is. And in this example it's a 4, which indicates neither favorable nor unfavorable, so a neutral response. Remember it's very important to always put the test value in this box, not to leave it as the default value of zero unless 0 happens to be what you're testing against. But this is a very common mistake, so be sure to put the population mean in the test value box here. OK that looks good so next let's click OK. And then we get our output here that opens up in the viewer window. And we can see that are 30 participants had a mean of 4.23, which was just slightly above neutral. So in other words, in the sample at least, the opinions were slightly better than neutral so slightly favorable, with a standard deviation of 1.43. Now looking at our One-Sample Test table this is where we're going to evaluate whether or not the test is statistically significant. That is, do people rate the politician significantly different from a neutral response, which was a number 4 in this example. So looking here at our p-value notice that we have a p-value of .379. Now if you recall we're going to use the decision rule that I described in the previous video on the one-sample t-test, so we'll use the following rule:
YouTube Channel: https://www.youtube.com/user/statisticsinstructor
Channel Description: For step by step help with statistics, with a focus on SPSS. Both descriptive and inferential statistics covered. For descriptive statistics, topics covered include: mean, median, and mode in spss, standard deviation and variance in spss, bar charts in spss, histograms in spss, bivariate scatterplots in spss, stem and leaf plots in spss, frequency distribution tables in spss, creating labels in spss, sorting variables in spss, inserting variables in spss, inserting rows in spss, and modifying default options in spss. For inferential statistics, topics covered include: t tests in spss, anova in spss, correlation in spss, regression in spss, chi square in spss, and MANOVA in spss. New videos regularly posted. Videos series coming soon include: multiple regression in spss, factor analysis in spss, nonparametric tests in spss, multiple comparisons in spss, linear contrasts in spss, and many more. Subscribe today!
YouTube Channel: https://www.youtube.com/user/statisticsinstructor
Lifetime access to SPSS videos: http://tinyurl.com/m2532td
Теги:
Student's T-test t-test one sample t single sample t test t test for one sample spss spss tutorial statisticsinstructor t test calculator one sample t test spss t test paired samples t test independent samples t test t test for single group t test for one group p-value spss free spss video tutorial SPSS (Software) Quantitative Specialists how to interpret independent t-test results spss paired t test spss
Похожие видео
Мой аккаунт