
Wednesday, 14 January, 2026г.


Где искать: по сайтам Запорожской области, статьи, видео ролики
пример: покупка автомобиля в Запорожье
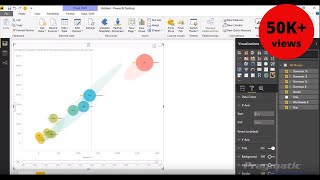
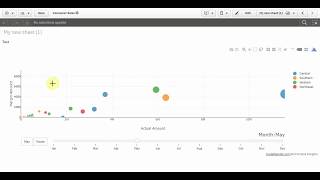
Power BI Custom Visuals - Impact Bubble Chart
 У вашего броузера проблема в совместимости с HTML5
Download a free 7-day trial of our On-Demand Training Platform: http://success.pragmaticworks.com/learn-power-bi
In this module, you will learn how to use the Impact Bubble Chart Custom Visual. The Impact Bubble Chart is an animated bubble chart that allows you to compare two entities against each other.
Похожие видео
Мой аккаунт