
Friday, 16 January, 2026г.


Где искать: по сайтам Запорожской области, статьи, видео ролики
пример: покупка автомобиля в Запорожье
Pivot Table - Qlik Sense
 У вашего броузера проблема в совместимости с HTML5
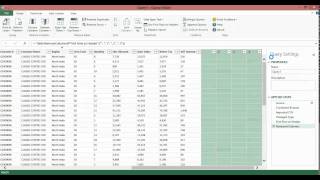
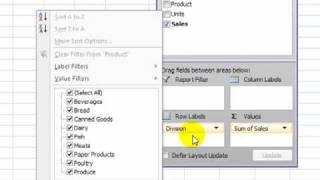
This video shows you how to work with pivot tables in Qlik Sense. Pivot tables present dimensions and measures as rows and columns in a table. In a pivot table, you can analyze data by multiple measures and in multiple dimensions at the same time. Moving measures and dimensions interchangeably between rows and columns is called “pivoting”. Pivot tables are particularly useful when you want to include several dimensions or measures in a single table, and then want to reorganize them to see different subtotals.
#Pivot #PivotTable #analytics #dataliteracy #datavisualizations #charts #Graphs
Теги:
Qlik November 2019 November 2018 data science data analytics September 2019 April 2019 Qlik Sense on Windows February 2019 understanding pivot table Pivot Table June 2019 Cloud editions of Qlik Sense data visualization February 2020 data analysis Business intelligence BI tool Creating visualizations Pivoting Qlik Sense
Похожие видео
Мой аккаунт