
Monday, 12 January, 2026г.


Где искать: по сайтам Запорожской области, статьи, видео ролики
пример: покупка автомобиля в Запорожье
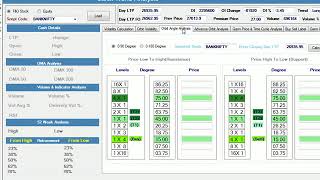
Nifty Trend For Next Week Technical Analysis 09 July - 13 July 2018
 У вашего броузера проблема в совместимости с HTML5
Nifty technical analysis for next week to predict nifty's weekly trend. Nifty 50 price chart and RSI on monthly weekly daily and hourly will be discussed in this video.
Nifty again failed at the resistance of 10806. We will analyze if this is a sign of gaining strength again or was it a final attempt before moving down
Register for members only updates
https://goo.gl/forms/2JB7pwVG0IChL5vJ2
1:54 Weekly Chart Analysis
3:48 Daily Chart analysis
4:52 Hourly Chart Analysis
5.57 Conclusion
Nifty Technical Analysis - Monthly
Despite volatility on the daily and hourly chart nifty is showing narrow range consolidation at current levels. This could be a preparation for next big move.
On the RSI nifty is trying to break resistance line drawn from RSI break of the 10-year monthly closing low trendline. Even RSI is almost flat. If Nifty rejects at current level then
it may find immediate support at 10739 which is the support line drawn from the recent monthly closing high on the RSI. Topside resistance is at 11027. Before going down into downtrend nifty has to break support of 10335.3.
Nifty Technical Analysis - Weekly
Nifty is trading above the trendline drawn on the price chart from 3 years weekly closing low which indicates that I will trade sideways to bullish. On the weekly chart, Nifty is showing signs of -ve diversion which may take nifty down to test support level of 10452.5. Topside resistance on the weekly chart is at 10806.6. On the RSI nifty experiencing the resistance at the horizontal line drawn from RSI break of the trendline drawn from historical -ve diversion line which also passes through historical weekly closing high.
Nifty Technical Analysis - Daily
On the price chart, Nifty again failed while breaking the resistance of 10806. Nifty is currently trading between support of 10637 and resistance of 10806.
similarly on the RSI nifty is trading between trendline drawn from all time daily closing and the trendline drawn from the recent daily closing low. We will have to monitor if nifty finds support on the RSI 50 level or not.
Nifty Technical Analysis - Hourly
On the Hourly chart nifty again took support on the support line drawn from RSI break point of recent hourly low's trendline. We will have to see how long this support hold.
Support is at 10697 and resistance is at 10821.85
Conclusion
After analyzing monthly, weekly, daily and weekly chart it looks like on the price we may see 10825- 10850 levels but if RSI doesn't improve then nifty will eventually come down.
One should avoid buy position at the current level. If someone wants to create a short position then strict stop loss should be placed at around 5-8 % level.
NOTE - This is not a financial advisor. I'm not a certified professional to give any advice. Data provided above is just for learning purpose so that you can make the better decision next time.
Before taking a trade do your own analysis or ask the financial expert.
Happy Trading! Jai Hind!
Теги:
nifty down nifty analysis nifty 50 chart study nifty nifty 50 nifty weekly trend nifty trend for next week nifty weekly analysis nifty next week nifty weekly technical analysis nifty technical analysis nifty weekly chart analysis nifty analysis for next week nifty share price nifty next support nifty next resistance indian stock market technical analysis nifty next move nifty index monthly trend technical chart analysis indian market bank nifty
Похожие видео


Мой аккаунт