
Sunday, 18 January, 2026г.


Где искать: по сайтам Запорожской области, статьи, видео ролики
пример: покупка автомобиля в Запорожье
How Trade The Tops & Bottoms In The S&P 500 Stock Index
 У вашего броузера проблема в совместимости с HTML5
You can learn more about how all this works in this Free video tutorial http://trendtraders.club/training-video
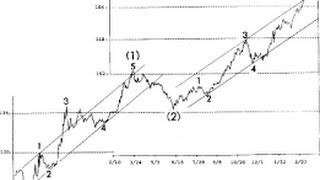
It's been a wild few weeks in the S&P 500, the Dow Jones and the Nasdaq in the US. To take a look at what happened as it related to Elliott Wave Analysis and what WD Gann taught us about markets, I went back to look at the posts from our Private Facebook Group that discussed the price and time action of the markets, and recorded this video to show you how I was able to trade into and out of the extreme highs and lows.
The top came in right on the Equinox on September 21st, the first lower high was on October 3rd, and the downtrend started to get underway on October 4th.
The market then fell completely out of bed for the next couple of weeks, and a significant low on October 29th (which I forecast in real time in our Private Facebook Group in both price and time on October 25th, 4 days beforehand).
Then we got a long entry signal with an initial price target at the .618 retracement (that was hit exactly), before getting short again.
Watching this tutorial will give you some solid principles of how markets move, how important it is to understand the current position of the market and how to trade around significant highs and lows in the major US stock indexes.
You can learn more about how all this works in this Free video tutorial http://trendtraders.club/training-video
Теги:
s&p 500 dow jones index nasdaq index swing charts swing trading trend trading wd gann rn elliott elliott wave elliott wave tutorial
Похожие видео


Мой аккаунт