
Sunday, 11 January, 2026г.


Где искать: по сайтам Запорожской области, статьи, видео ролики
пример: покупка автомобиля в Запорожье
Highest GDP Per Capita for G20 Countries (1900 to today)
 У вашего броузера проблема в совместимости с HTML5
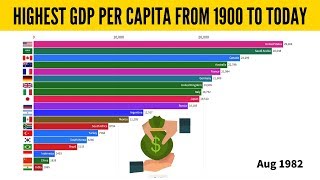
Highest GDP Per Capita for G20 Countries from 1900 to today.
Subscribe to our channel if you enjoyed watching this animation! We loved doing it. You'll be seeing more uploads like this one very consistently.
This animated chart shows you a graphical representation of the G20 countries with the highest GDP per capita. The GDP per capita was adjusted for price changes over time (inflation) and price differences between countries. It is measured in international-$ in 2011 prices.
An international dollar would buy in the cited country a comparable amount of goods and services a U.S. dollar would buy in the United States. This term is often used in conjunction with Purchasing Power Parity (PPP) data.
The chart below clearly shows the economic growth in different world regions since 1870.
What we learn from this chart is that on average the people of the past were many times poorer than we are today. For example, in 1870 the global GDP per capita is estimated to be around 1,263 international-$ per year and this is already after some world regions have achieved economic growth.
In 2016, the average GDP per capita was 14,574 international-$ – more than 10-times the average of the past.
It is often the case that progress creates inequality between regions because it is not happening equally as fast everywhere. If we compare the economic prosperity of every region today with any earlier time we see that every single region is richer than ever before in its history.
Though the economies in some regions are more productive than others, every region is doing better than ever before.
From the data that we have discussed previously, we know that with respect to economic growth all the action really just happened very recently. It is true that in the pre-growth era some people were very well off, but this was the tiny elite of the tribal leaders, pharaohs, kings and religious leaders. The economic inequality in pre-modern societies was extremely high and the average person was living in conditions that we would call extreme poverty today.
The destitution of the common man only changed with the onset of economic growth. The time when this change happened in various countries is depicted in the following graph. Economic prosperity was only achieved over the last couple of hundred years. In fact, it was mostly achieved over the second half of the last hundred years.
The rise of global average incomes, global GDP per capita, shows when the world economy has become a positive-sum-game. This made it possible that when people in one place became richer, other people in other places could become richer at the same time.
Was your country on the list of the highest gdp per capita countries in the world?
Check out the other types of work we do on IG and LinkedIn!
Instagram: https://www.instagram.com/worldwide_e...
LinkedIn: https://www.linkedin.com/company/1582...
* Need similar charts made for your company or business? Get in touch: [email protected]
Data Source: https://ourworldindata.org/economic-growth
About: This video is entitled 'Highest GDP Per Capita for G20 Countries from 1900 to today' by Chart by Worldwide Engineering. The video shows you a graphical representation of the highest gdp per capita countries, as well as the gdp per capita ranking 2019. GDP per capita explained is a measure of a country's standard of living. Top GDP per capita are countries that have undergone development earliest. This video should help give you a good representation of the richest country in the world. Enjoy the watch!
#chartsbyworldwideengineering
Теги:
highest gdp per capita countries top gdp countries gdp per capita ranking 2019 gdp per capita explained top gdp per capita top 10 gdp per capita countries 2019 highest gdp countries in the world gdp per capita by country charts by worldwide engineering richest country in the world richest country in the world 2019 comparison top 10 top 10 country ranking india gdp us gdp per capita china gdp per capita europe gdp per capita india gdp per capita 2019
Похожие видео


Мой аккаунт