
Wednesday, 14 January, 2026г.


Где искать: по сайтам Запорожской области, статьи, видео ролики
пример: покупка автомобиля в Запорожье
Going beyond Dashboards with IBM Cognos Analytics : Container within Container | packtpub.com
 У вашего броузера проблема в совместимости с HTML5
This playlist/video has been uploaded for Marketing purposes and contains only selective videos.
For the entire video course and code, visit [http://bit.ly/2xm2Vg4].
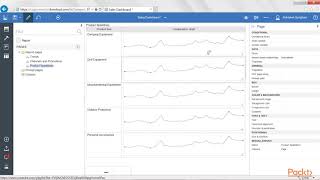
Putting a data container, chart or visualization within another data container - and then defining relationship between them so that meaningful data is retrieved, is called MASTER DETAIL relationship. Let's see how to do this.
• Create a LIST report to pull PRODUCT LINES
• Insert Sparkline chart within the LIST to achieve repeating chart at each row
• Define relationship between them to pass appropriate context
For the latest Big Data and Business Intelligence video tutorials, please visit
http://bit.ly/1HCjJik
Find us on Facebook -- http://www.facebook.com/Packtvideo
Follow us on Twitter - http://www.twitter.com/packtvideo
Теги:
dashboards IBM Cognos Analytics Data Modeling building blocks Cognos 11 Cognos BI QlikView Tableau Connection Portal Cognos Analytics Data Flow
Похожие видео

Мой аккаунт