Monday, 12 January, 2026г.


Где искать: по сайтам Запорожской области, статьи, видео ролики
пример: покупка автомобиля в Запорожье
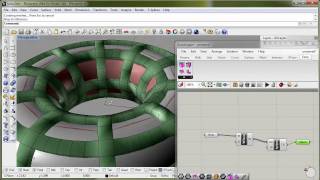
DIVA Grasshopper 09 ArchsimHourly
This tutorial demonstrates how to analyze hourly simulation results from a single zone thermal simulation using DIVA 4/Archsim and to display the results in a psychrometric chart using DIVA 4/Archsim. Rhino scene files and/or Grasshopper component files are available from http://solemma.net/grasshopper_tutorials.html
Похожие видео
Мой аккаунт


 У вашего броузера проблема в совместимости с HTML5


