
Monday, 19 January, 2026г.


Где искать: по сайтам Запорожской области, статьи, видео ролики
пример: покупка автомобиля в Запорожье
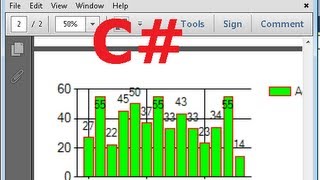
C# chart in visual studio
 У вашего броузера проблема в совместимости с HTML5
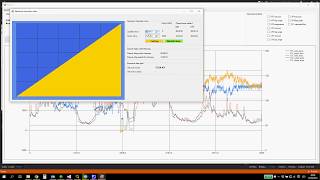
For my application I developed a technique to display data in a chart. Application of the video is programmed in Microsoft Visual Studio C # programming language. To render the chart is used in Chart component. Tooltip on the series displays the name of the chart and the time stamp value at a point where the mouse cursor is located. Rendering eight thousand points were very slow, the situation has considerably improved, when I used to draw the type of "FastLine". The result can be seen on the video. Please press the like or taken - in the case of great interest to create a tutorial for this job.
www.ondrashova-automatizace.cz
Похожие видео


Мой аккаунт