
Sunday, 18 January, 2026г.


Где искать: по сайтам Запорожской области, статьи, видео ролики
пример: покупка автомобиля в Запорожье
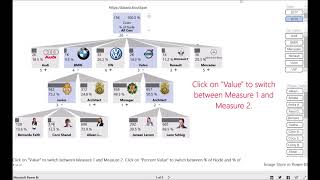
Breakdown Trees (Power BI visualization)
 У вашего броузера проблема в совместимости с HTML5
The Breakdown tree makes it possible to visually display the full drill-down path of a measure. By keeping all levels in the drill-down path visible you will get a good overview of how your numbers break down, from the top level to the details at the bottom.
Note that this is a video of a custom visualization created for the Power BI visual contest.
Похожие видео


Мой аккаунт