
Saturday, 17 January, 2026г.


Где искать: по сайтам Запорожской области, статьи, видео ролики
пример: покупка автомобиля в Запорожье
Basic Design Principles
 У вашего броузера проблема в совместимости с HTML5
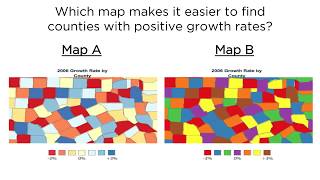
To understand, identify and manipulate the chart features that can help and hinder communication to your audience. These include: Chart junk, data-ink ratio, data integrity, data richness, scales, color, and attribution.
DATA VISUALIZATION INSIGHT
► Create killer presentations with effective data visualizations. Join Kristen’s mailing list for the latest insights and news: http://kristensosulski.com/join-the-mailing-list
LEARN MORE
► Subscribe for more videos: http://bit.ly/SubscribeKristenSosulskiYouTube
► Read Kristen’s blog: http://kristensosulski.com/category/data-visualization
► Learn about Kristen’s trainings, speaking, and consulting: http://kristensosulski.com/live-trainings
CONNECT
► https://twitter.com/sosulski
► https://facebook.com/DrKristenSosulski
► https://linkedin.com/in/sosulski
KRISTEN SOSULSKI
► Dr. Kristen Sosulski develops innovative practices for higher education as the Director of Education for the NYU Stern W.R. Berkley Innovation Lab. She also teaches MBA students and corporate executives data visualization, R programming, and operations management as an Associate Professor at NYU’s Stern School of Business.
► Kristen’s passion for technology and learning sciences converges in all facets of her career, inside and outside of the classroom. For more information, visit: http://kristensosulski.com
Похожие видео


Мой аккаунт