
Tuesday, 18 November, 2025г.


Где искать: по сайтам Запорожской области, статьи, видео ролики
пример: покупка автомобиля в Запорожье
bashtrace, debugger for Bash scripts in Python
 У вашего броузера проблема в совместимости с HTML5
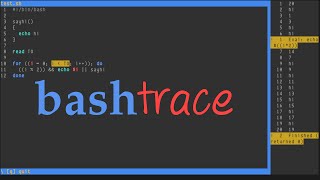
bashtrace [1] is the first debugger with UI I have ever tried.
You have output by line number on the right, the script content in the main window with syntax highlighting, and call stack on top (0:10).
Debugging functions includes step, skip, continue, evaluate (0:28), return, and input (0:05), just like common debugger in most parts.
There are a few command-line options (0:02), such as `--break`, which allows you to set up breakpoint but you can't set up breakpoint in the UI.
$$$#
% ./bashtrace.py -b : test.sh
% cat test.sh
#!/bin/bash
sayhi()
{
echo hi
}
read TO
for ((i = 0; i != TO; i++)); do # != for YouTube description
((i % 2)) && echo $i || sayhi
done
$$$#
* git-a8ba9b07ab41009a22fd47220d18b58f7b65fc66 (2016-05-04)
* In Python and Bash with ncurses
* By Radek Brich
* MIT License
[1]: https://github.com/rbrich/bashtrace
Похожие видео
Мой аккаунт