
Monday, 12 January, 2026г.


Где искать: по сайтам Запорожской области, статьи, видео ролики
пример: покупка автомобиля в Запорожье
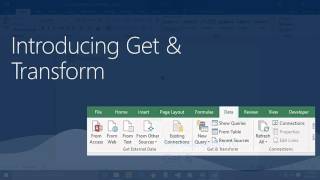
Analyzing And Visualizing Data With Excel 2016
 У вашего броузера проблема в совместимости с HTML5
In this workshop, get an introduction to the latest analysis and visualization capabilities in Excel 2016. See how to import data from different sources, create mash/ups between data sources, and prepare the data for analysis. After preparing the data, learn about how business calculations - from simple to more advanced - can be expressed using DAX, how the result can be visualized and shared.
Теги:
Excel
Похожие видео
Мой аккаунт