
Wednesday, 14 January, 2026г.


Где искать: по сайтам Запорожской области, статьи, видео ролики
пример: покупка автомобиля в Запорожье
Accumulation and distribution on the YM Emini - classic volume price analysis
 У вашего броузера проблема в совместимости с HTML5
Check out the indicators at https://www.quantumtrading.com Risk Disclosure: https://goo.gl/nnmrwP TESTIMONIAL DISCLOSURE: TESTIMONIALS APPEARING ON QUANTUM TRADING MAY NOT BE REPRESENTATIVE OF THE EXPERIENCE OF OTHER CLIENTS OR CUSTOMERS AND IS NOT A GUARANTEE OF FUTURE PERFORMANCE OR SUCCESS.
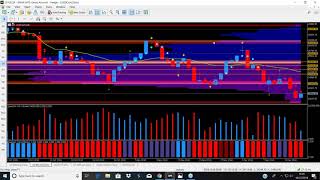
Accumulation and distribution is one of the key components of volume price analysis and in this session we take a look at the US markets and in particular the YM emini over the weekly and monthly timeframes. As equity markets continue to weaken under the pressure of the FED, understanding and identifying these regions is key for longer term investors. But of course, accumulation and distribution takes place in all timeframes and all markets and it is these constant and repeating waves of buying and selling which then create the classic Wyckoffian cycles of price action, from accumulation to distribution and back again.
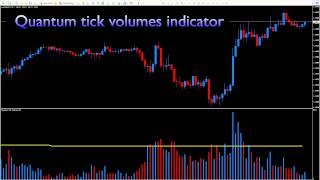
In this week's session I explain the concepts and principles in more detail before moving on to focus on the emini indices and trading as an intraday scalper using the Quantum Trading tools and indicators in both time and tick charts, along with the renko on NinjaTrader.
Теги:
ninja indicators ninjatrader indicators MT5 index trading MT5 indicators indicators for MT5 indicators for Ninja anna coulling quantum trading quantum indicators indicators index trading
Похожие видео
Мой аккаунт