
Sunday, 11 January, 2026г.


Где искать: по сайтам Запорожской области, статьи, видео ролики
пример: покупка автомобиля в Запорожье
MATLAB 101: How to Plot two lines and label it on the same graph
 У вашего броузера проблема в совместимости с HTML5
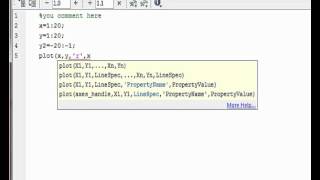
How to plot using matlab basic commands This is the code to use as a reference for your MATLAB code. %you comment here x=1:20; y=1:20; y2=-20:-1; plot(x,y,'r',x,y2,'g'); legend('Y','Y2'); xlabel('Time'); ylabel('Data'); %you can use semicolon here if you want on either the x or ylabel title('Data Vs Time'); grid;
Теги:
MATLAB 101 Graphing plot editing software tutorial How-to-use matlab plotting coding c++ mathcad modeling
Похожие видео


Мой аккаунт